

Fluent in flavor: using machine learning to build a flavor language for whiskey
Smoke. Coal dust. Fine leather. Dark berry fruit. Coffee grounds.
So many descriptors and personal perceptions swirl around a glass of whiskey. Published whiskey reviews include sensory and non-sensory descriptions of thousands of these distilled spirits.
Finding meaning in and understanding these descriptors is at the heart of discriminating whiskey connoisseurs’ debates. But even for the not-so-discriminating, all of these words can be confusing for investigating the taste and value of a bourbon that costs $130 a bottle - when a $55 similar substitute would do.
A research project by food science faculty member Jacob Lahne, graduate student Leah Hamilton, and University Libraries’ data consultants Chreston Miller, and Michael Stamper received a SEAD Major Grant from The Institute for Creativity, Arts, and Technology (ICAT) to create a tool that finds a common language in a data set of 6,500 published whiskey reviews of about 50 - 100 words each.
ICAT awards SEAD grants to projects that bring together scientists, engineers, artists, and designers to tackle some of the world’s most complex challenges. Figuring out how to consistently and systematically describe whiskey could be an important and complex challenge for many, but beyond this specific food product, the deep learning tool this project creates could be used for all research that uses descriptive data.
The team is applying Natural Language Processing (NLP), a subfield of linguistics, computer science, information engineering, and artificial intelligence that involves programming computers to process and analyze large amounts of natural language data — whiskey descriptors.
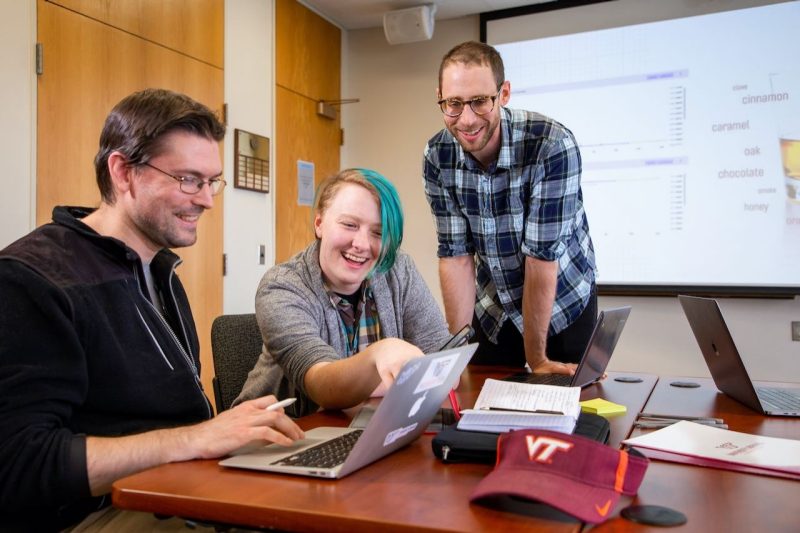
Chreston Miller, Leah Hamilton, Jacob Lahne. Photo by Trevor Finney.
This data science technique offers researchers opportunities to analyze more data than what was possible through the traditional time-intensive and expensive manual text analysis process. According to the project team, there have been no previous attempts to apply this sort of NLP approach for sensory-evaluation purposes.
“These data sets haven’t been studied by anyone else. One of the nice things about whiskey is its enthusiast market,” said Lahne. “People care about taste deeply. Whiskey lives or dies by sensory perception. These reviews are in metaphorical, messy, natural language. What we’re trying to get to is some shared concept about taste.”
Hamilton said they may even be able to make connections among the descriptors used, the production process, and the geographical origin of the liquor.
“This tool will analyze free-response comments and identify which words are describing flavor and separate them from what’s not descriptive,” said Hamilton. “It will also identify which words are related and describe the same flavor. This will ultimately be helpful to consumers who may want to buy something that’s close to a high dollar whiskey but is more affordable.”
As a computer scientist with research interest in qualitative data, Miller is excited about what this project could mean as a proof of concept for a larger proposal.
“There is value in a tool with deep learning, also called machine learning,” said Miller. “Deep learning is a machine learning technique based on how neural connections in the brain process information. By training the tool, we are able to comb through more information and make sense of it more quickly and efficiently than a human brain. If we throw enough data at it, the peculiarities are diluted. This is a new area of research and one that is very exciting.”
When the team has its common language defined, they will pass the data to Stamper, a graphic designer specialized in interactive design, to create visual interfaces that help audiences draw insight and meaning from the data.
“We will define our target audiences and build an interface to communicate the data. We can use visualizations to see how we can dig deeper into the information,” said Stamper. “We can include geographic visualizations, temporal visualizations. It will be a very interactive opportunity for the audience to experience the data in new ways.”
Upon the completion of the year-long process, the team will raise a glass to future research that could build upon this novel approach they have begun.
“At some point, we may get to a place where we describe flavors like we do colors - it would be standardized,” said Hamilton. “This is a great step in that direction.”